Almost Everyone Rallied. One Sector Didn't Get the Memo.
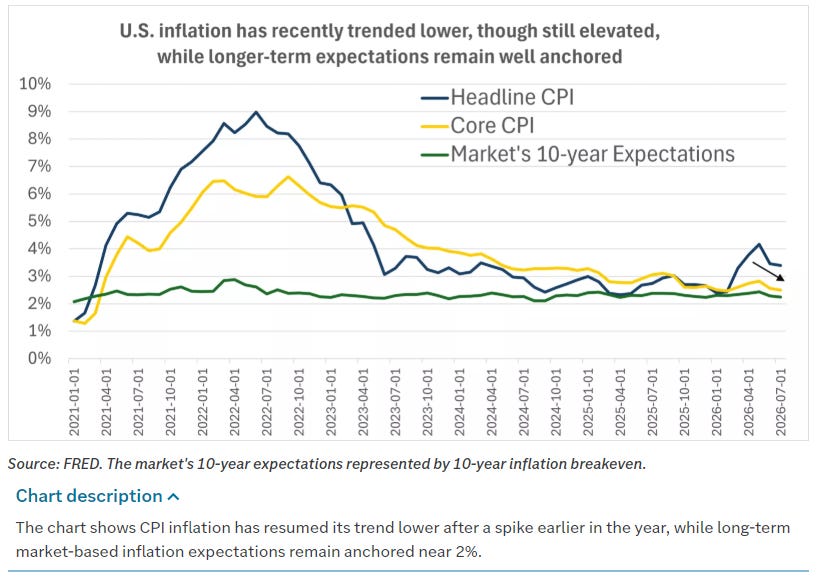
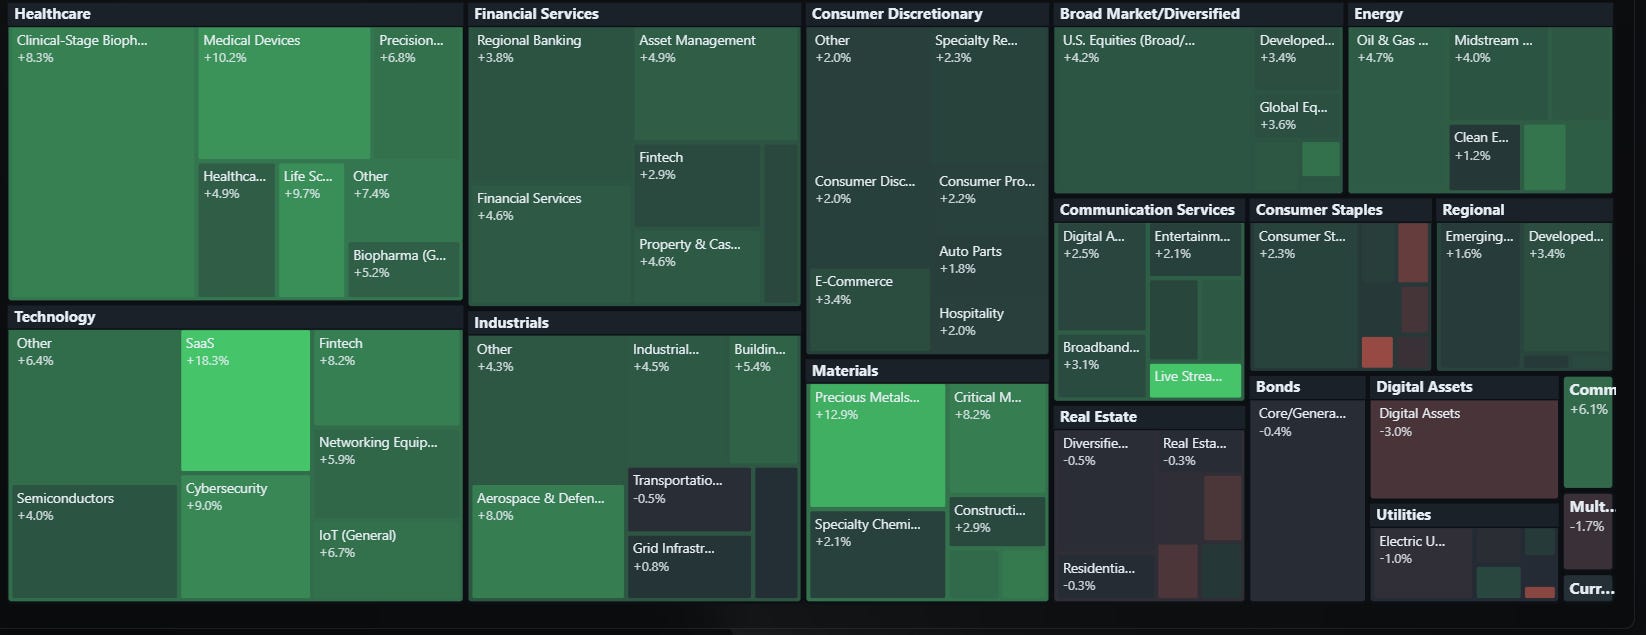
A cooler CPI print lifted almost every sector this week, leaving Consumer Discretionary the odd one out.

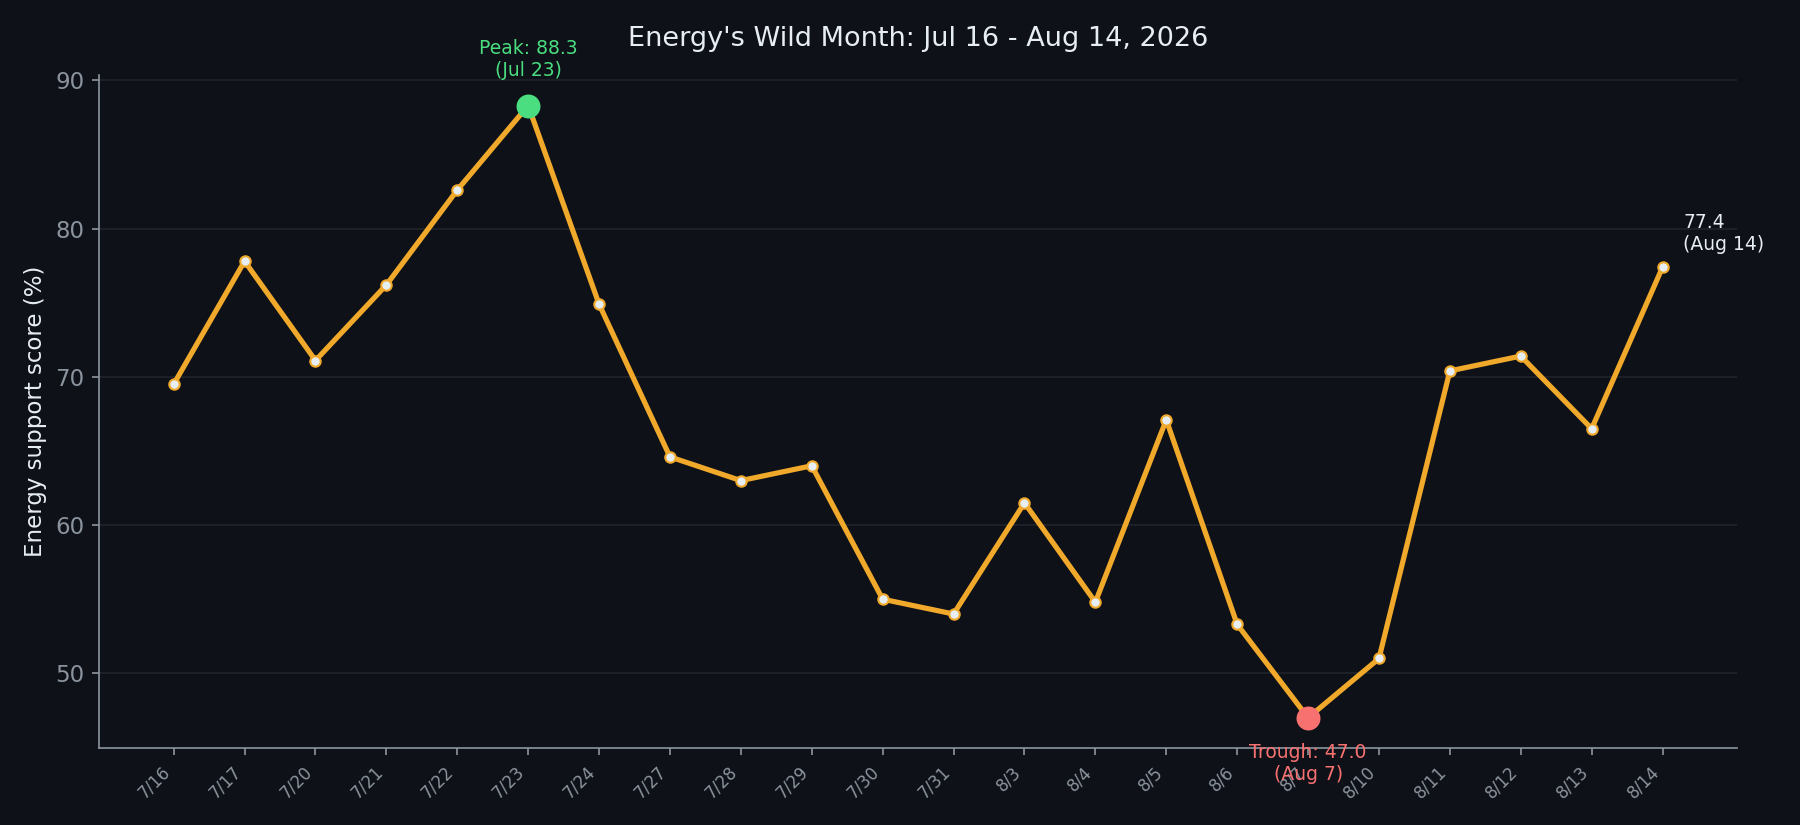
Three weeks ago, Energy’s support score hit 88.3, the strongest single reading anywhere on my board all summer. Two weeks ago it was 54.0, most of that gone. Last week it bottomed at 47.0. This week it closed at 77.4, up 26.4 points from Monday alone, its best week since the original spike.
That is not a trend. That is a sector that has now completely reversed direction three separate times in a month, each swing bigger than most sectors see in a quarter. I flagged the tell to watch two weeks ago: whether Energy’s Relative Rotation Graph trail would actually cross down into Weakening territory, ratio still above 100 but momentum below it, which would mean price catching down to what the support score had already been signaling. It did. Energy now sits at roughly 112 on relative strength and 83 on relative momentum, squarely in Weakening. And then, in the same week that happened, the support score jumped 26 points in the other direction entirely. The tell arrived. It just did not resolve the story the way a clean tell is supposed to.
The shape of the week
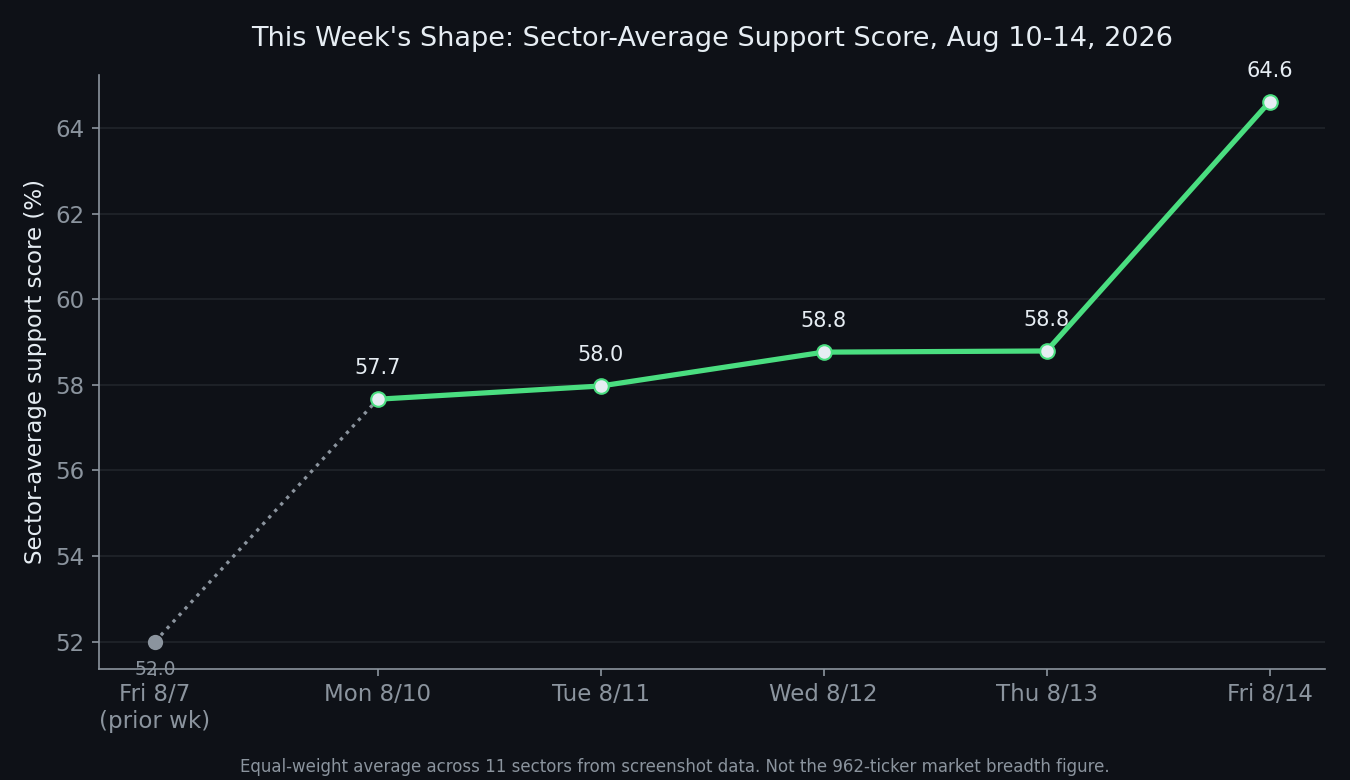
Energy was the extreme, but this was a broad week. Ten of eleven sectors finished higher than they started. The sector-average support score, equal-weight across the eleven sectors I track and share publicly, climbed every single day: 57.7, 58.0, 58.8, 58.8, then a jump to 64.6 on Friday. That Friday number is the highest close in the data I have going back a month.
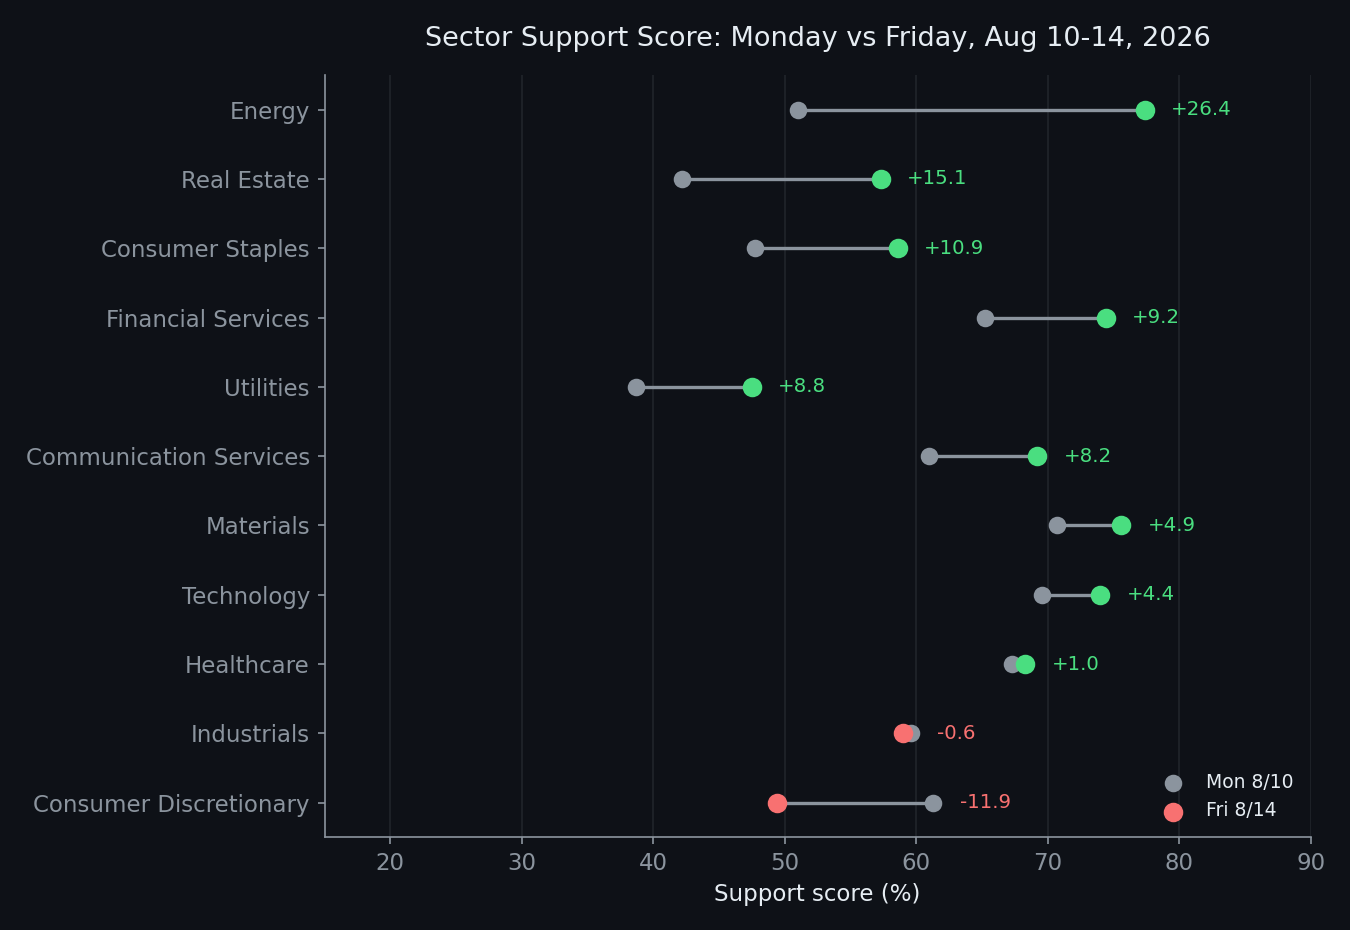
The winners, sorted by size of move: Energy (+26.4), Real Estate (+15.1), Consumer Staples (+10.9), Financial Services (+9.2), Utilities (+8.8), Communication Services (+8.2), Materials (+4.9), Technology (+4.4), Healthcare (+1.0, essentially flat). Industrials was also essentially flat (-0.6). Only one sector actually fell: Consumer Discretionary, down 11.9 points, the week’s lone red number on an otherwise green board.
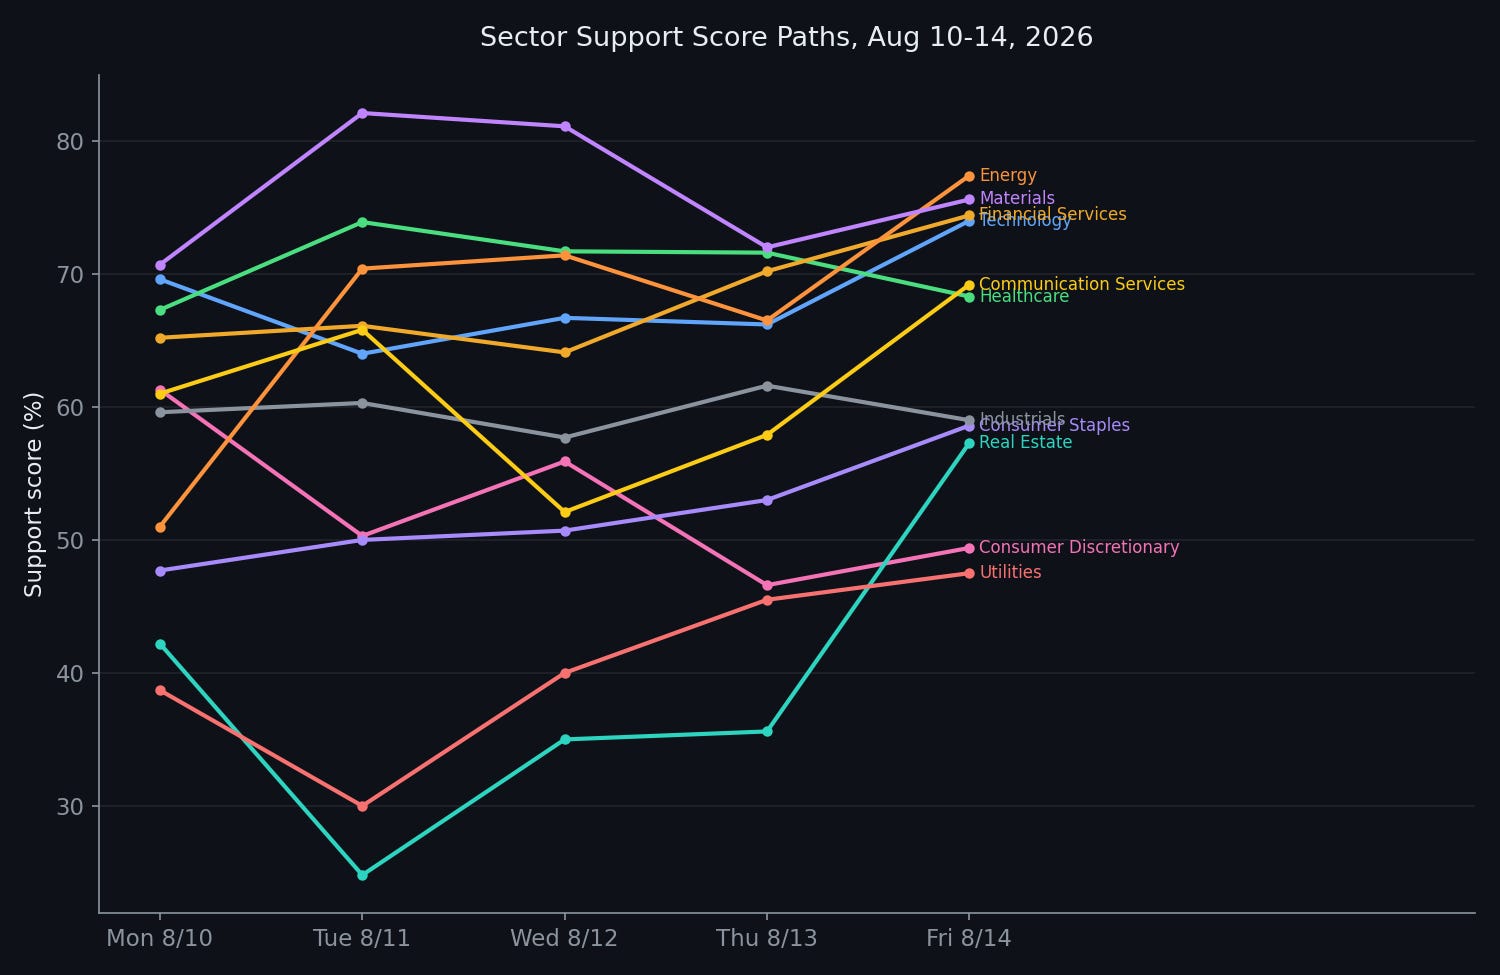
Real Estate deserves a mention beyond its headline number, because the path there was not smooth. It opened Monday at 42.2, fell to 24.8 Tuesday, sat in the 30s Wednesday and Thursday, then rocketed to 57.3 Friday. That is a lot of movement to net out to a single positive weekly number, and it is a reminder that even sectors with a clean-looking Monday-to-Friday change can be jumpy underneath.
What was actually behind it
Cooling inflation. Most macro sources are leading with some version of the same headline this week. “Cooling inflation” as the one shared headline everyone is running with is about as strong a confirmation as macro triangulation gets, and it is a genuinely different backdrop than three weeks ago, when everyone was writing about oil pushing rates higher.
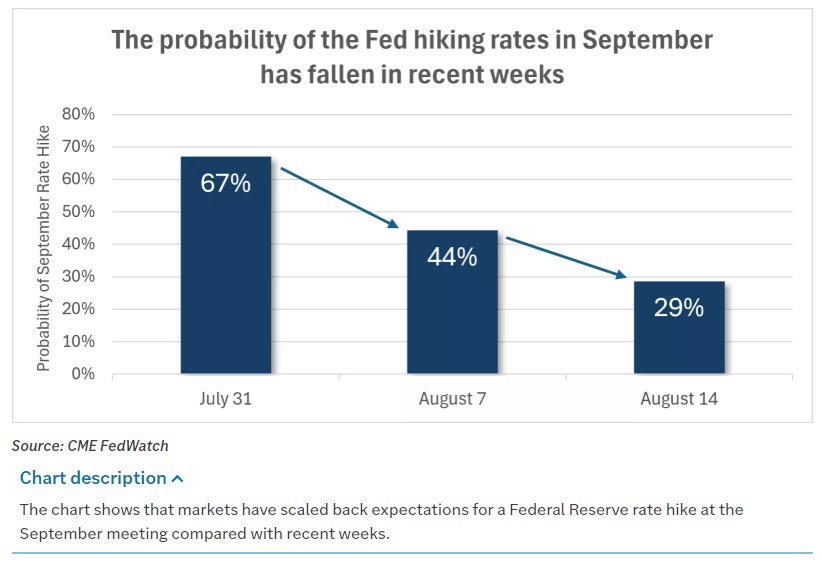
The specific number that seems to have moved markets: the odds of a September Fed rate hike falling sharply over recent weeks, from a chart reading roughly 67 percent down to roughly 28 percent. Three weeks ago, when Energy first peaked, the story was oil-driven inflation risk pushing the Fed toward a hike, with fed funds futures pricing something close to a certainty of one by September. This week, a cooler CPI print did the opposite: it took a meaningful chunk of that hike risk back off the table, and the broad rally in my support-score data lines up with that timing exactly. Falling rate-hike odds is the kind of catalyst that lifts nearly everything at once, which is consistent with ten of eleven sectors moving the same direction this week, something a single-sector story like an earnings beat or a commodity move rarely produces.
Worth balancing that against news that U.S. retail sales dropped and consumer sentiment slid the same week, a reminder that a cooling-inflation rally and a cooling-consumer economy can show up in the same report without contradicting each other, they are measuring different things. Cooling inflation is good news for a Fed pause. A ceasefire easing oil’s geopolitical premium is, on its face, not obviously good news for an Energy sector that just had its best week of the summer. It’s a strange tension that’s worth sitting with since it is exactly the kind of thing that would explain why Energy’s price-based momentum and its level-based support score are pointing in different directions right now.
Where the data disagrees with itself again
Energy’s Weakening signature on the RRG, discussed above, is a bit of a paradox. Consumer Staples is a quieter second one. My support score for Staples rose 10.9 points this week, one of the larger gains on the board, but on the RRG it sits at roughly 84 on relative strength and 87 on relative momentum, both under 100, which puts it in Lagging territory, not Improving, let alone Leading. Institutions may be sitting above more of the sector’s areas of institutional engagement this week, but Staples is still losing ground to the market on a relative-strength basis. Both things can be true. They are just not telling you the same thing about what to do next.
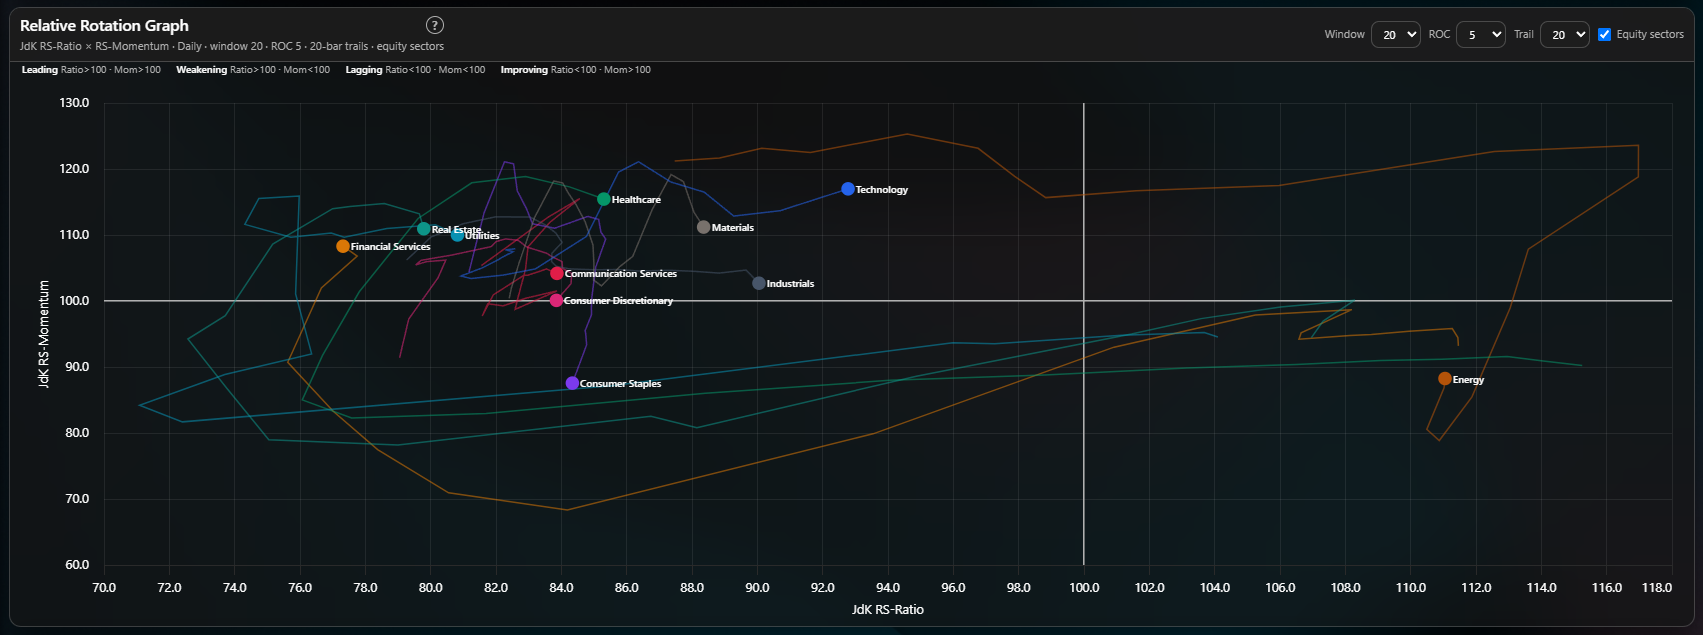
Technology and Materials are the cleanest agreement on the board this week: both improved in my data, both sit near the Leading quadrant on the RRG, around 90 to 94 on relative strength and well above 110 on momentum, and Friday’s detailed breakdown puts both near the top of the sector distribution. When my data, the RRG, and the box plot all point the same direction, that makes for a pretty confluent read. Energy and Staples, this week, are the reminder that this does not happen for every sector every week.
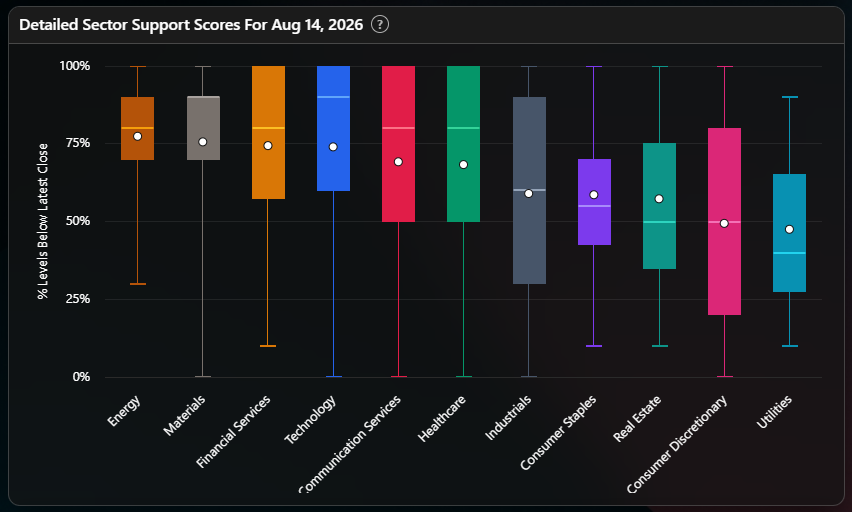
On Friday’s box plot, one more pattern worth flagging: Utilities’ mean sits meaningfully above its median, the same propped-up-by-a-few-strong-names pattern I flagged for Technology and Industrials two weeks ago. Utilities had a good week by the headline number, but the typical utility name is still weaker than that headline suggests. Consumer Discretionary, the week’s one decliner, also has the widest box on the whole chart, meaning the names inside it disagree with each other more than any other sector’s. That is not one clean story, it is several different stories wearing the same sector label so choose names inside that sector carefully.
What this means, by your clock
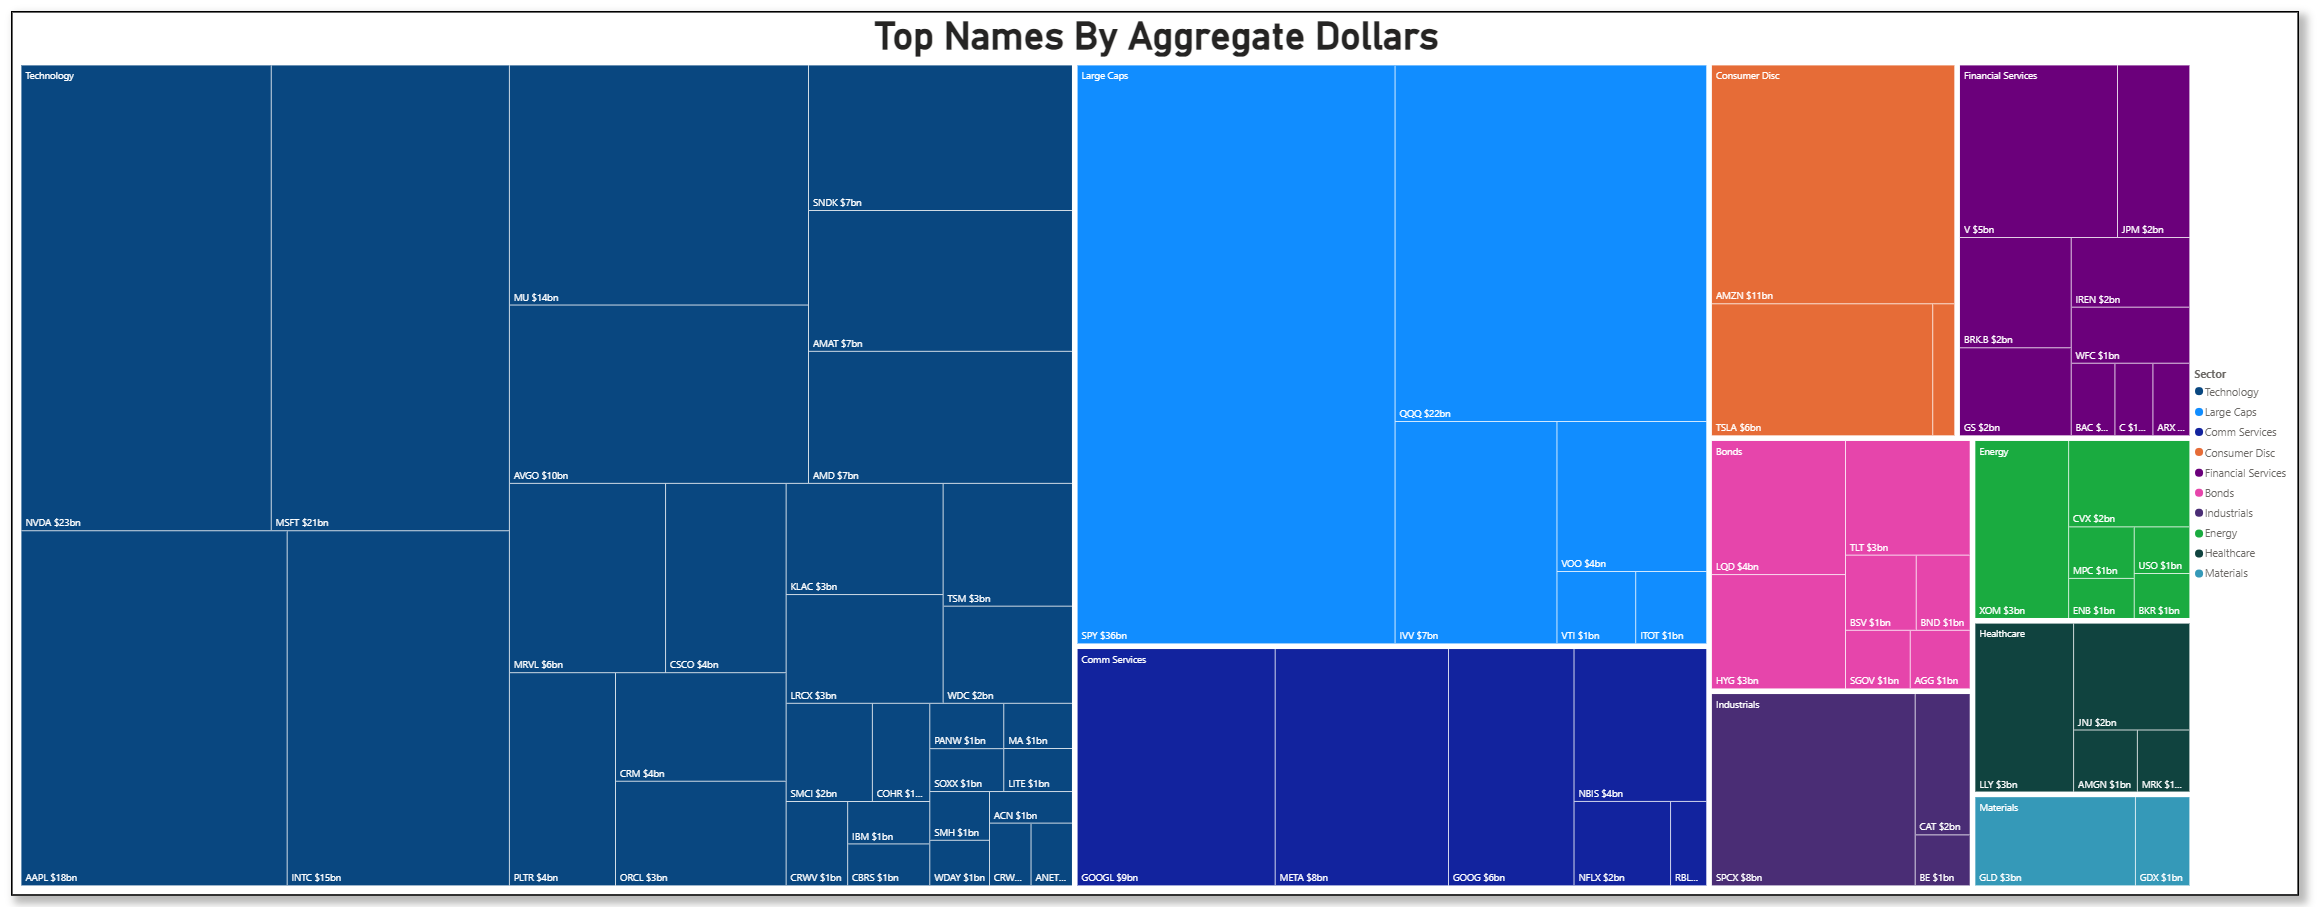
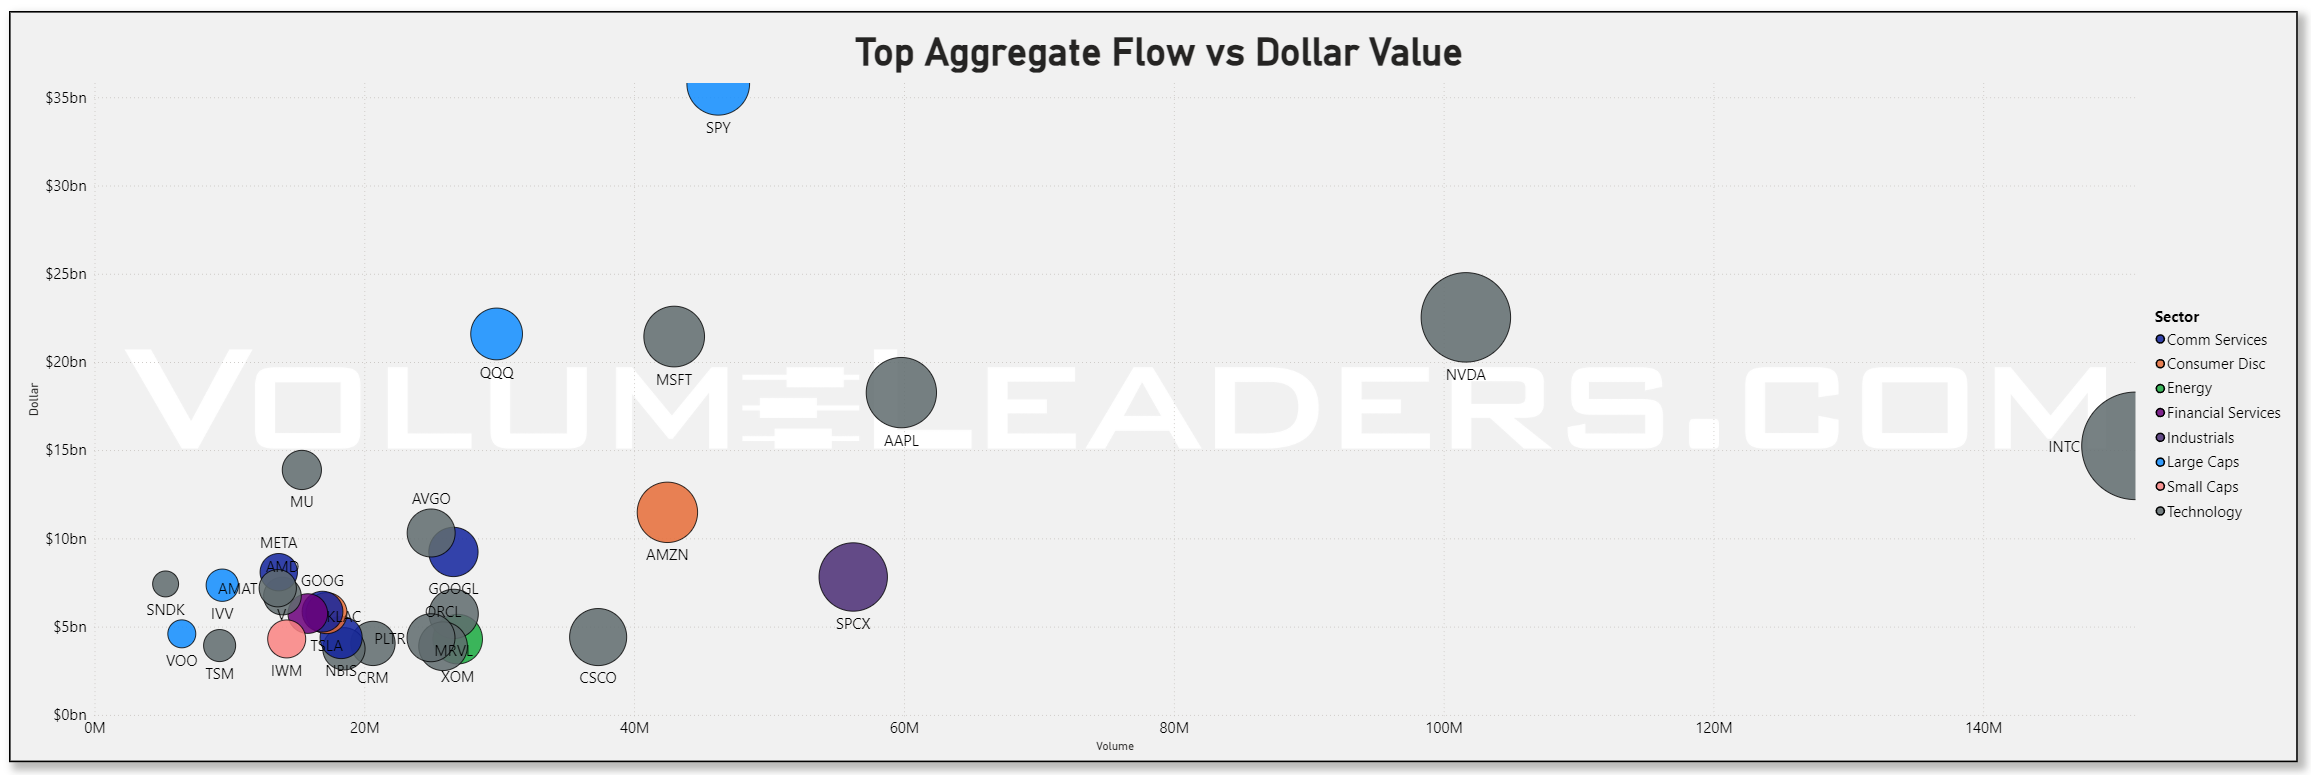
If you trade in days to weeks: do not treat this week’s broad rally as proof that the market has fully repriced. It has a real catalyst, cooling inflation and falling hike odds, which is more than I can say for some of the moves in this data set, but Energy specifically has now round-tripped three times in a month and does not deserve confidence until it survives a second week without giving it back. The RRG saying Weakening while the support score says the opposite is not a reason to pick a side, it is a reason to size the position smaller than the headline number would suggest. If you are inclined to fade Consumer Discretionary’s decline, the box plot says pick names rather than the sector, the disagreement inside that group is unusually wide right now, wider than anywhere else on the board.
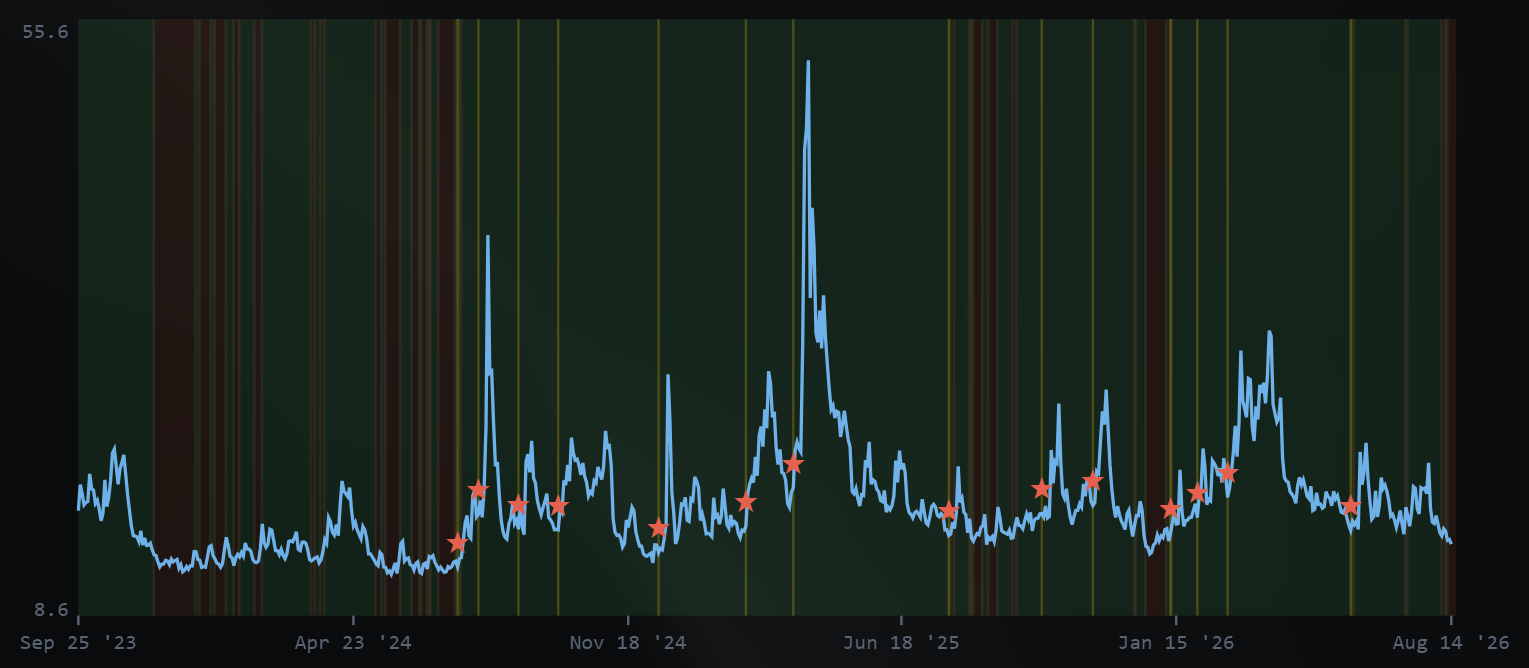
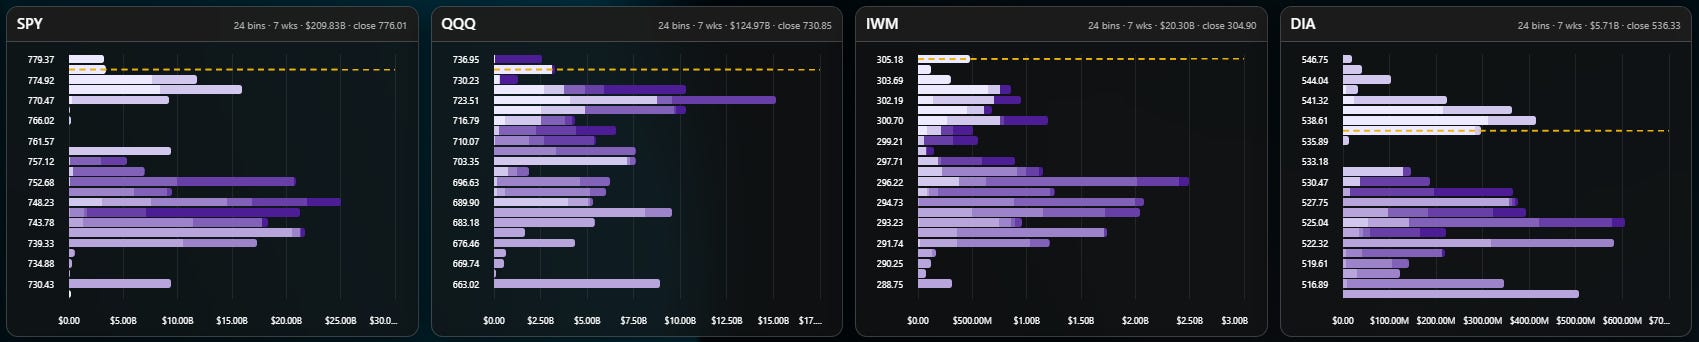
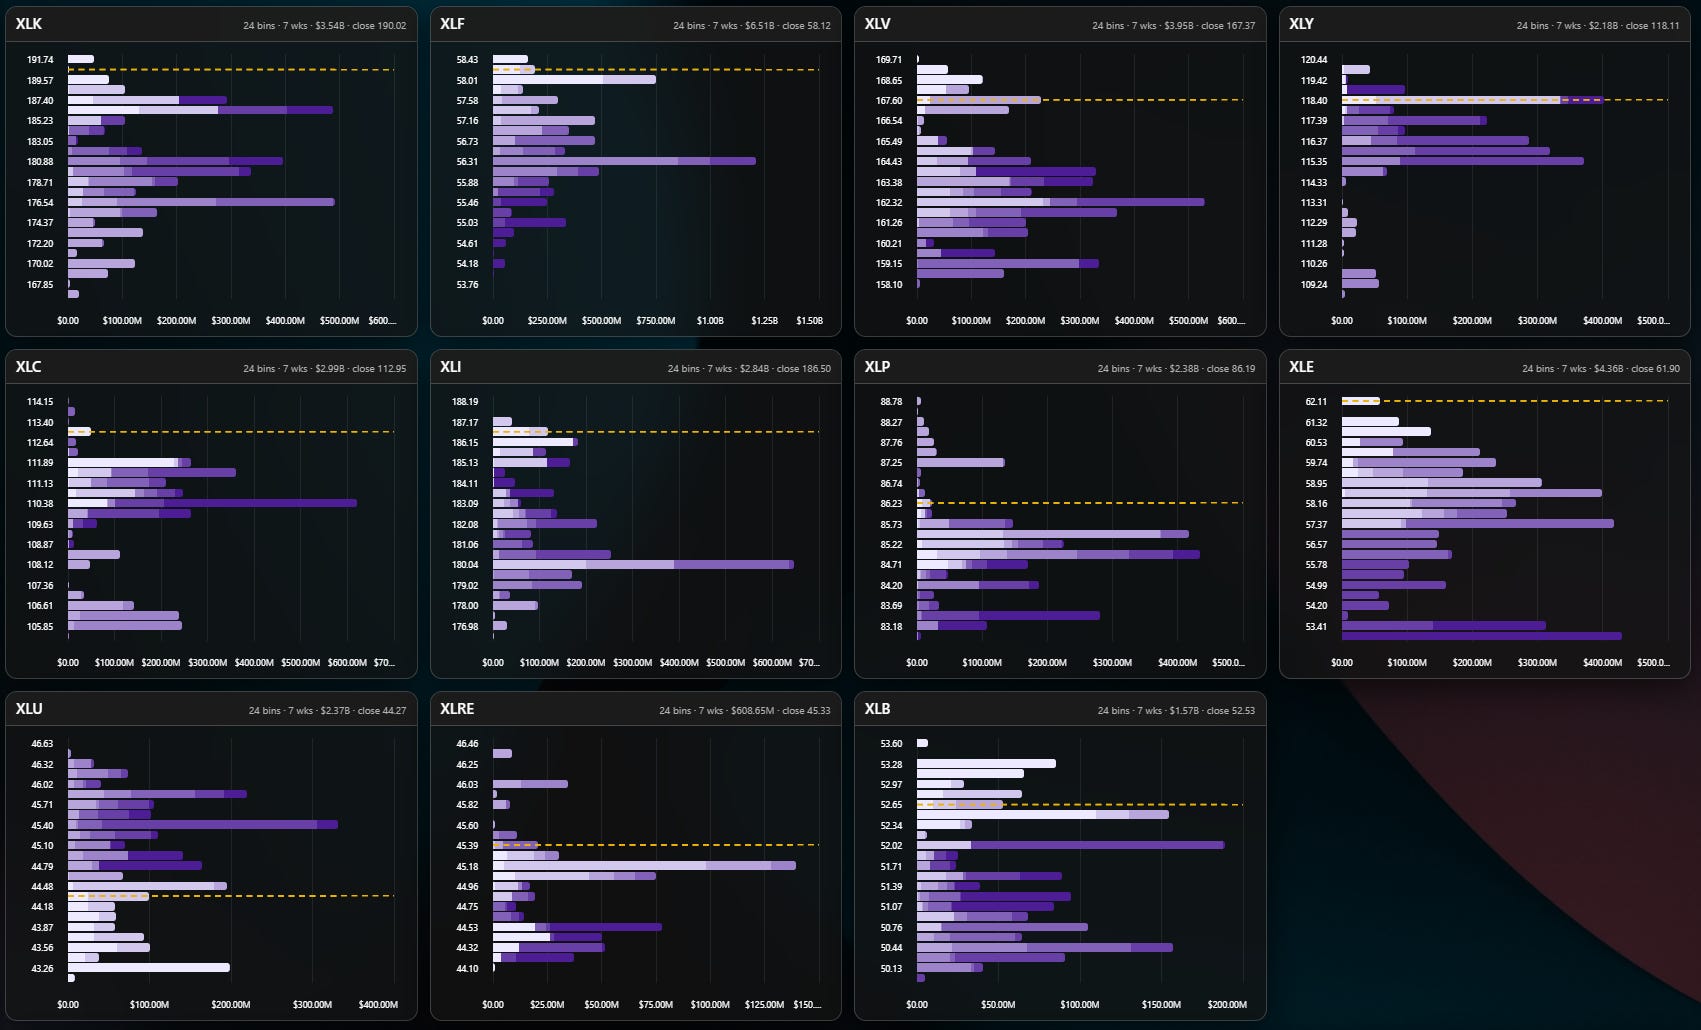
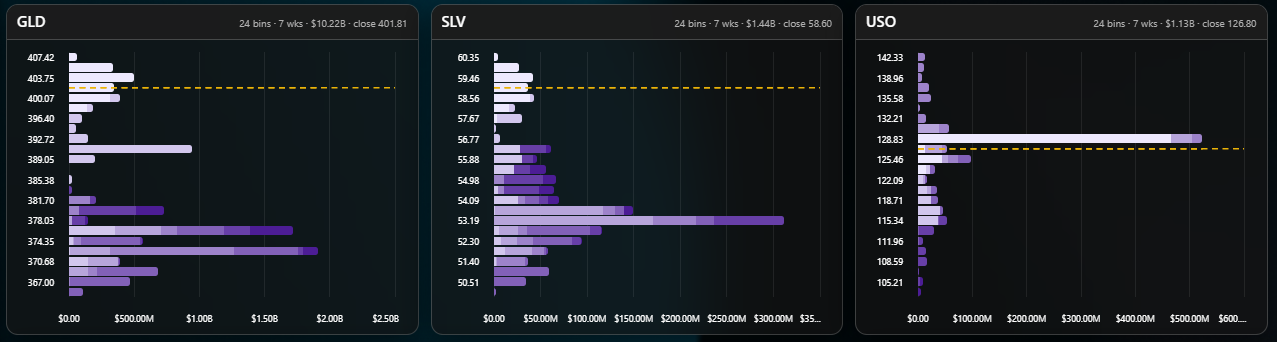
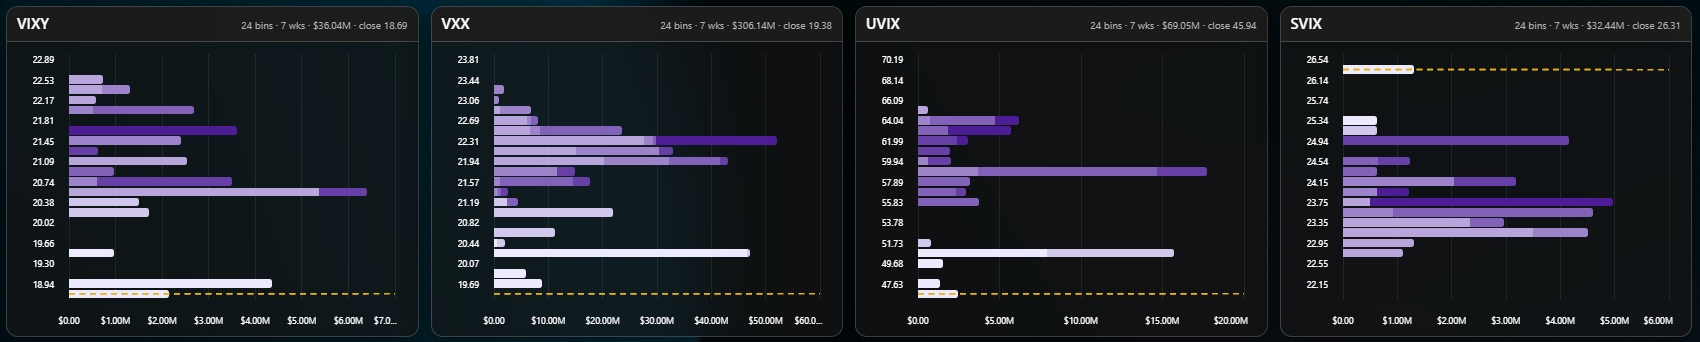
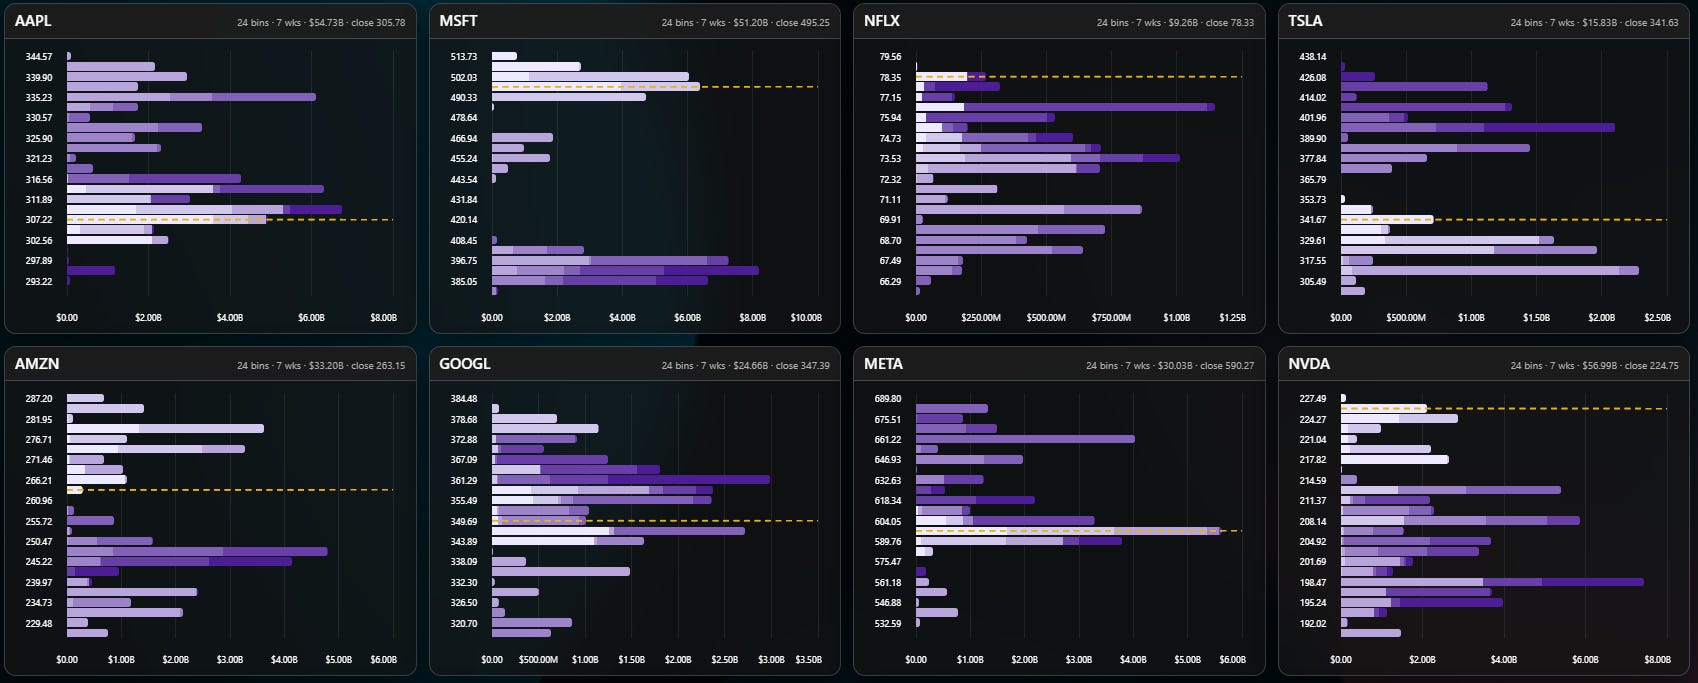
If you invest in months to years: the bigger story is that the inflation and rate-hike fear that drove the entire hard-asset rotation a month ago has substantially unwound, at least by the market’s own pricing. A broad, ten-of-eleven-sectors rally on falling hike odds is a healthier signal than any single sector’s leadership, hard asset or otherwise, and it is a meaningfully different market than the one “Oil Grabbed the Wheel” described three weeks ago. Watch whether Energy’s RRG trail can climb back above the momentum line in the next couple of weeks. If it can, this week’s jump was real and the Weakening signature was the lagging indicator, not the leading one. If it can’t, and the support score gives back this week’s gain the way it has twice already, that would make round trip number three, and at that point the pattern itself, not any single week’s reading, becomes the story worth telling. Vol continues to compress under VIX 15 to the lowest levels seen in some time which creates a fragile environment if headline shocks manifest. Regimes can be stubborn so if you decide to invest in downside protection, buy ample time. Here are few charts showing you where institutions are positioned vs where we closed the week:
Indices
Major Sector ETFs
Commodities
Volatility
Megacap Tech
Talk soon, Bruce

Thank you for being part of this community and for investing your time in this week’s edition. The quality of this readership — thoughtful, disciplined, engaged — is what makes this work meaningful. I’m grateful to build alongside you. Here’s to a week of clarity, conviction, and well-executed opportunities.
— VolumeLeaders